We link production machines to ERP and planning systems in all kinds of ways, to automate order administration and be able to show dashboards with management information.
But what about the PV installation? It produces too, doesn’t it?
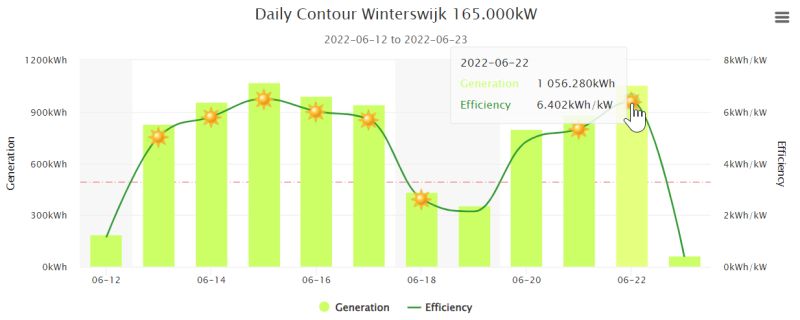
That is why Contour’s PV installation is connected to the public PVOutput comparison site, InfluxDB and MQTT.
As soon as the new signage screens are hung in the new building, they will show a slide with the current PV production.
We have made the Python source code and Docker container public, so that others with a similar installation can build dashboards too.